

Interactive platform · SEO · GEO · Data visualisation
Leren Investeren
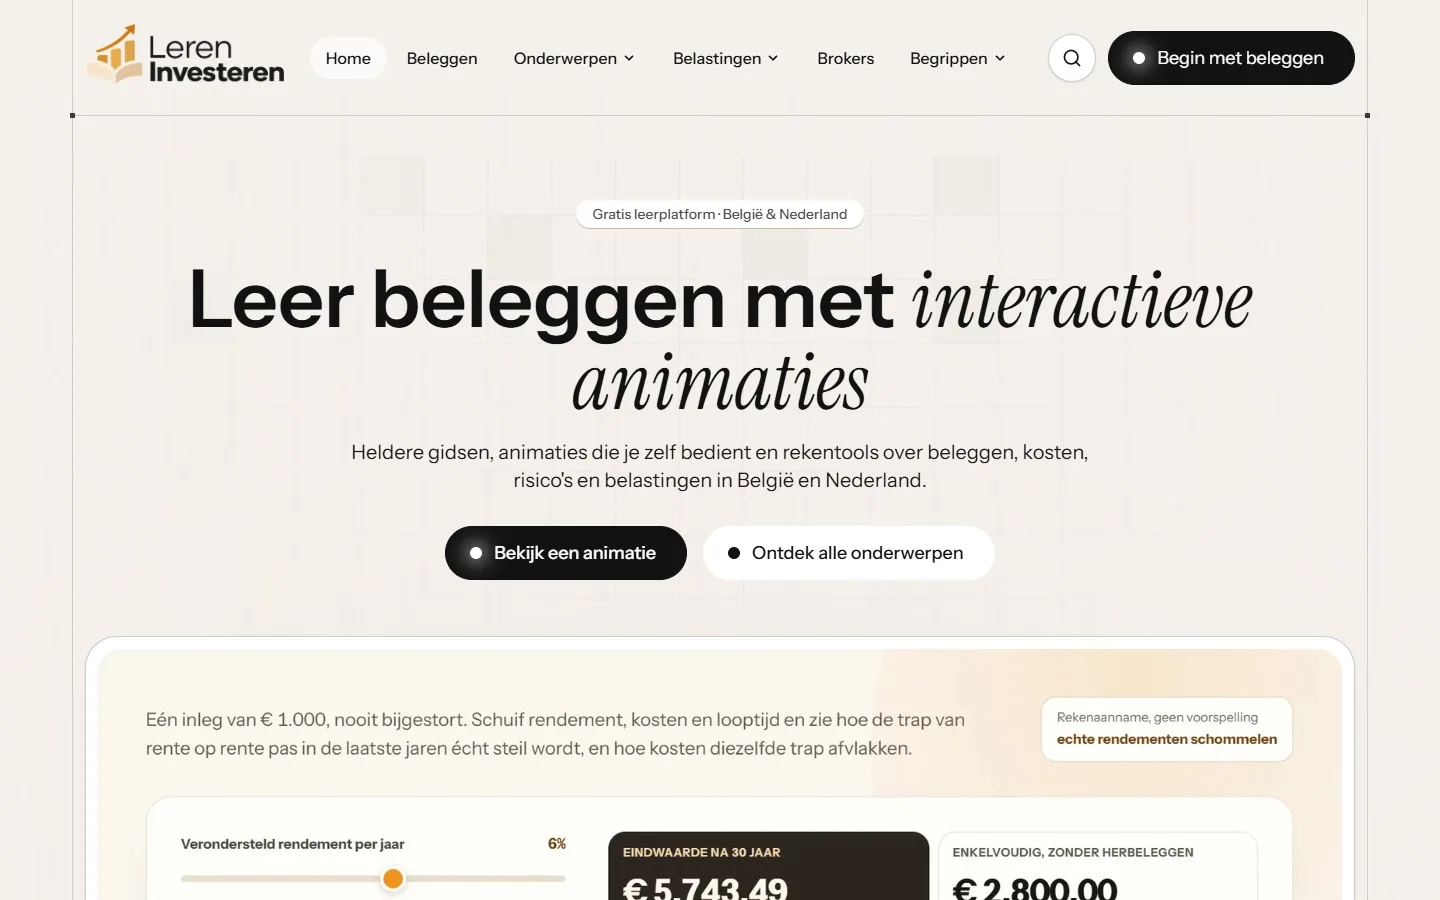
An interactive education platform that makes complex financial topics understandable with hundreds of guides, calculators and more than 250 visualisations you control yourself.
- Dries Nijs's role
- Dries Nijs's role in this project is awaiting confirmation.
Challenge and solution
Financial topics are abstract: you only really understand compound interest, costs or taxes when you see what happens as a number changes. The platform had to show that at scale, for two countries with different rules, while staying clear about what it is: explanation, not advice.
An education platform in which hundreds of guides are complemented by visualisations that visitors control themselves, calculators and a glossary. Belgium and the Netherlands get separate pages where the rules differ, and every guide shows its sources and the date it was last updated.
Features
- Hundreds of guides across twelve topics, each with sources and a last-updated date
- More than 250 interactive animations, placed within the guides themselves
- Nine calculators and tools
- A glossary with a dedicated page for each term
- Separate tax sections for Belgium and the Netherlands, and country versions that reference each other
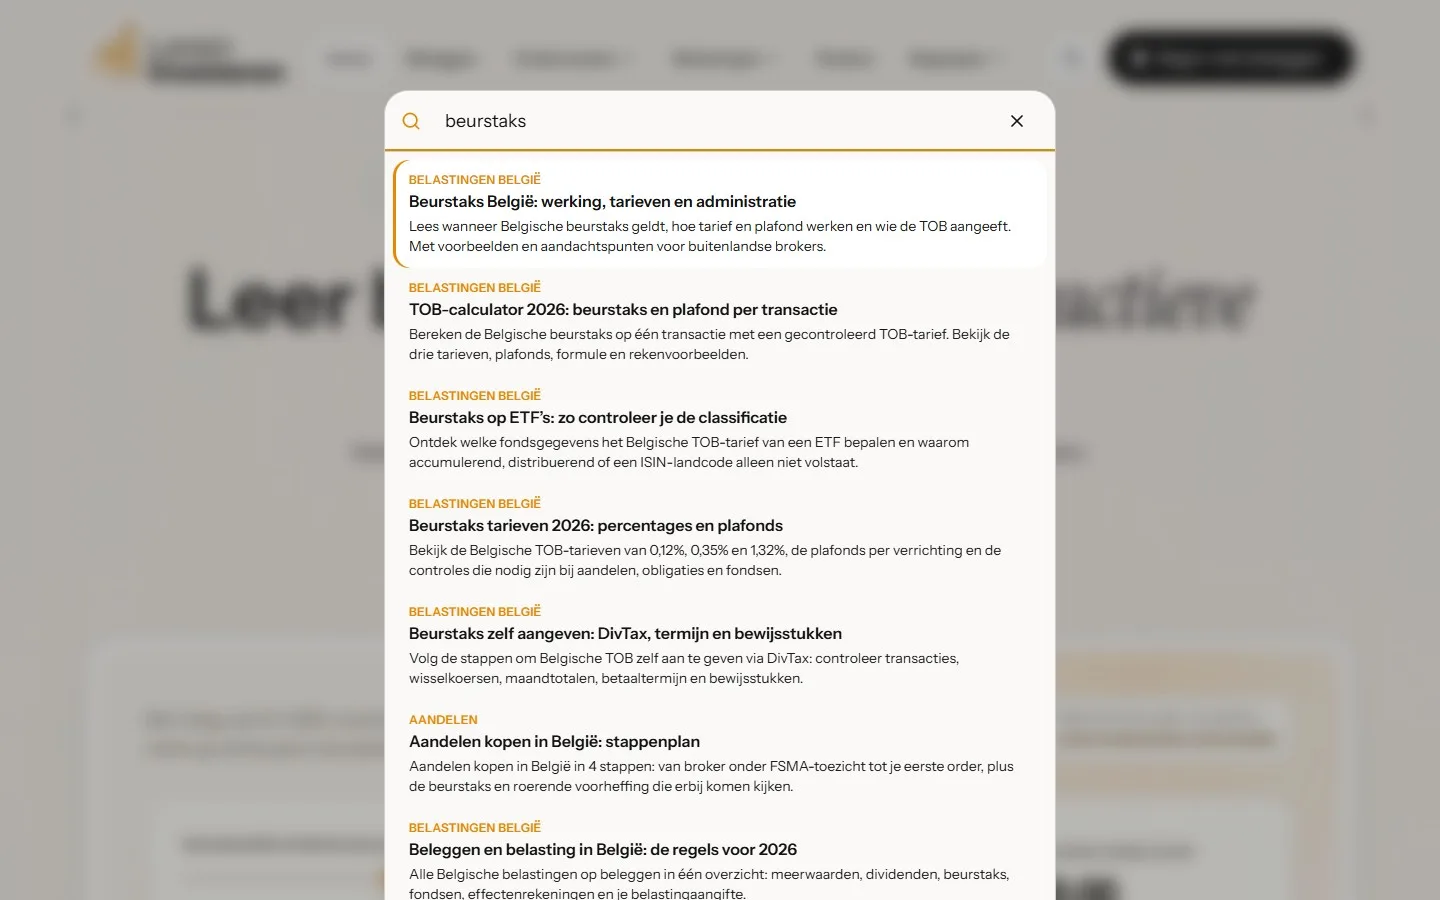
- A search function covering all pages
- Frequently asked questions and structured data on the guides
- Disclaimer, privacy policy, cookie policy, terms of use and a page about the editorial team
SEO and visibility
The guides are grouped into twelve topics, with an overview page for each topic. A guide contains a definition block, a short summary, subheadings phrased as questions, frequently asked questions, a list of sources and structured data. For Belgium and the Netherlands, there are country versions that reference each other. That is the foundation for SEO and for GEO (Generative Engine Optimization).
Project information last reviewed for accuracy on .
Project overview
Leren Investeren is an investing education platform for Belgium and the Netherlands. It explains financial topics with guides, calculators and visualisations that visitors control themselves.
The platform provides explanations, not personal investment advice. On lereninvesteren.eu this is stated at the bottom of every page.
It is one of the most extensive projects in this portfolio, both in the amount of content and in the number of interactive components.
- 298guides with cited sources
- 264interactive animations
- 9calculators and tools
- 67terms explained
Figures from the lereninvesteren.eu homepage, checked on 18 November 2026. The platform is growing, so the numbers may since have increased.
More than 250 visualisations you can control yourself
The animations are the heart of the platform. They are not decorative moving images: each animation is a small calculation model that visitors set up themselves, and it shows immediately what happens to the outcome.
- Change amounts, such as a deposit or a sum of capital.
- Adjust percentages, such as return, costs or inflation.
- Change time horizons, from a few years to several decades.
- Choose an example with one click and see the difference.
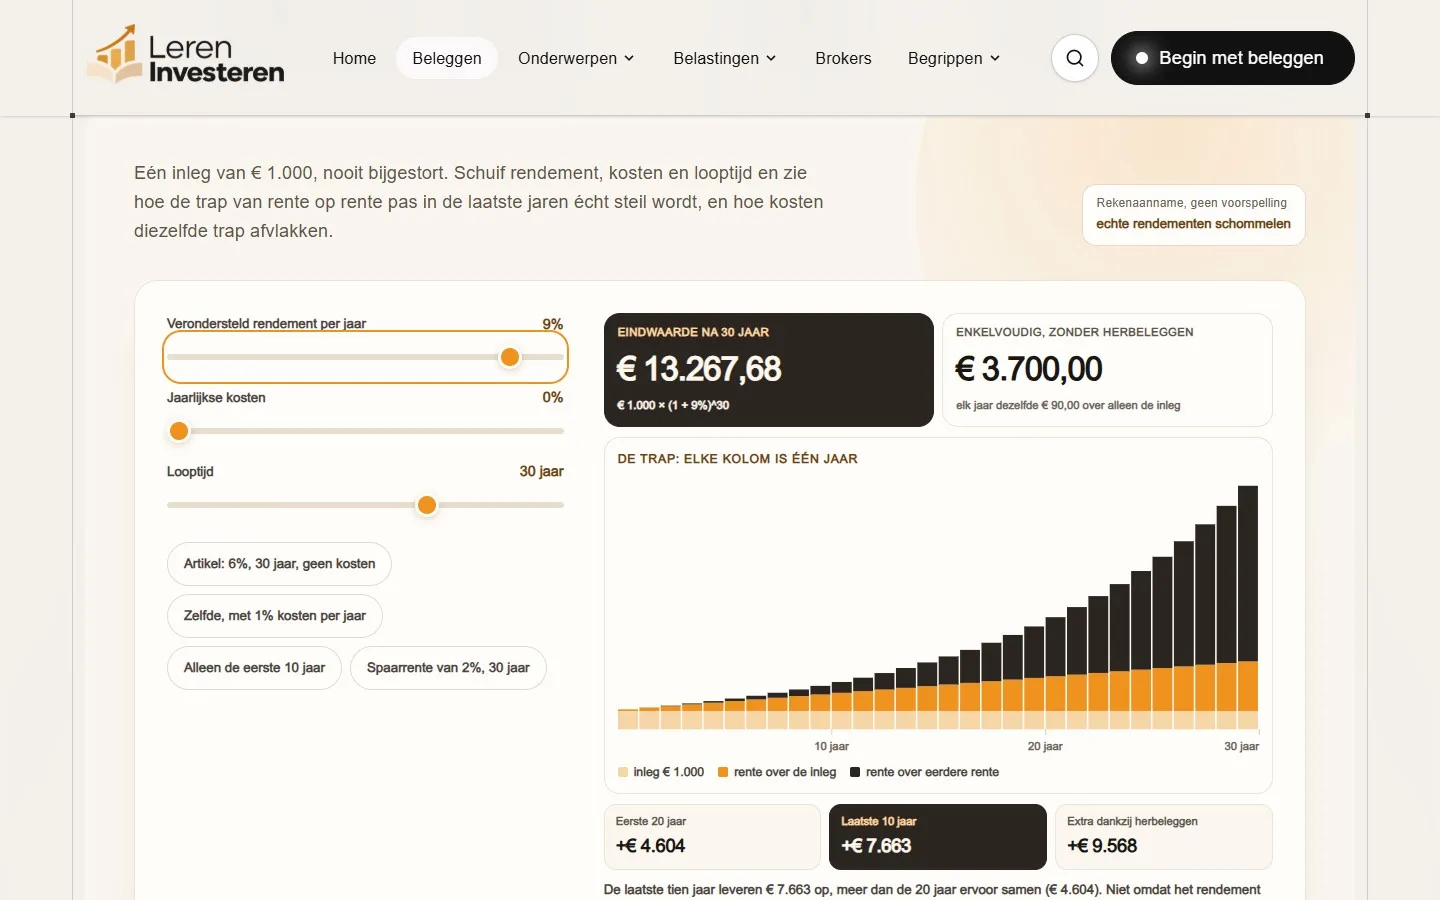
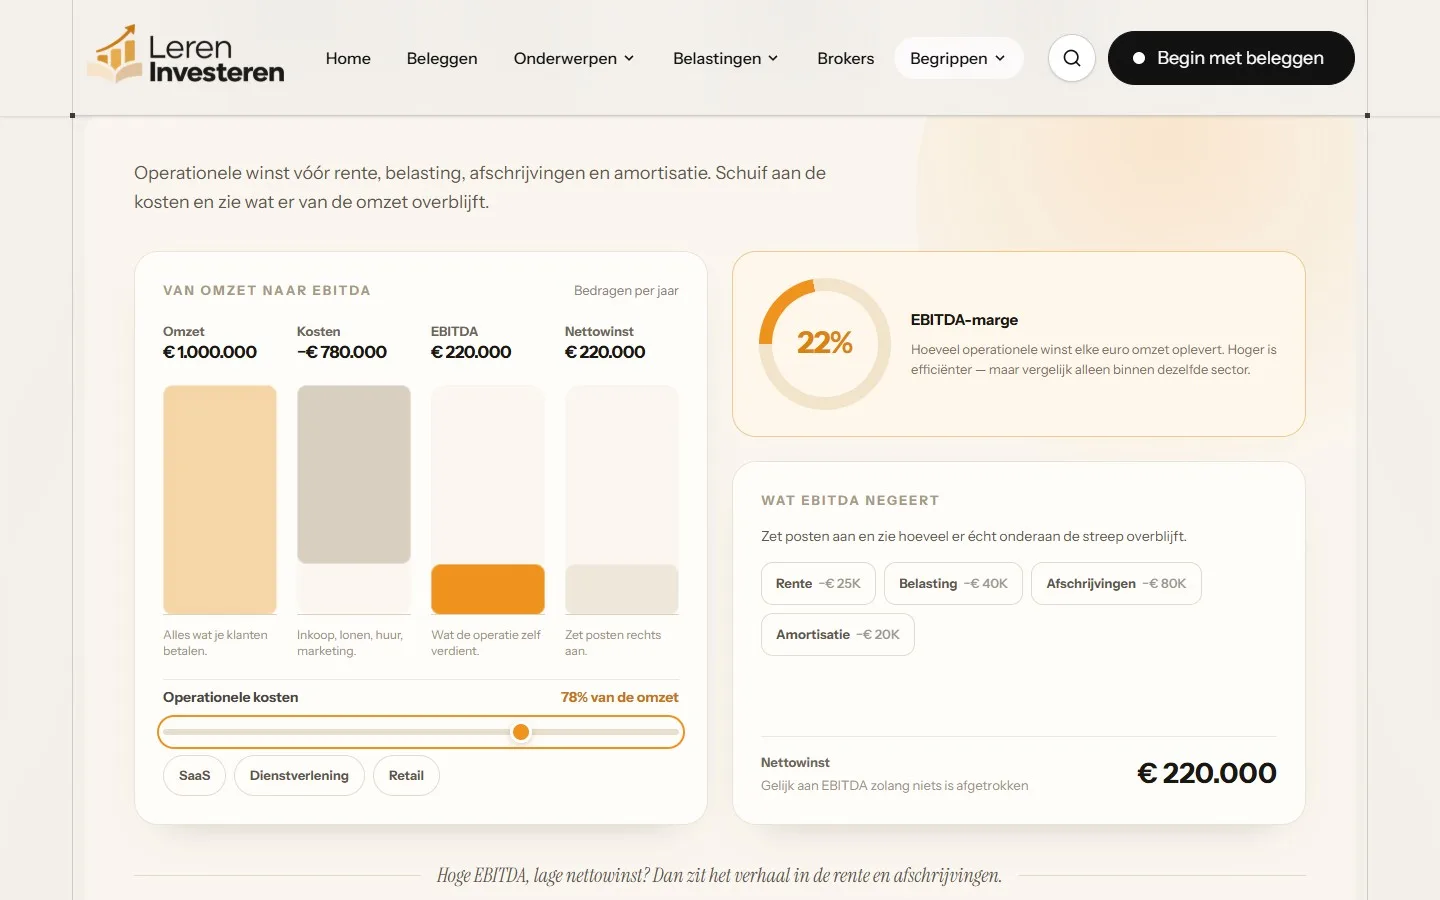
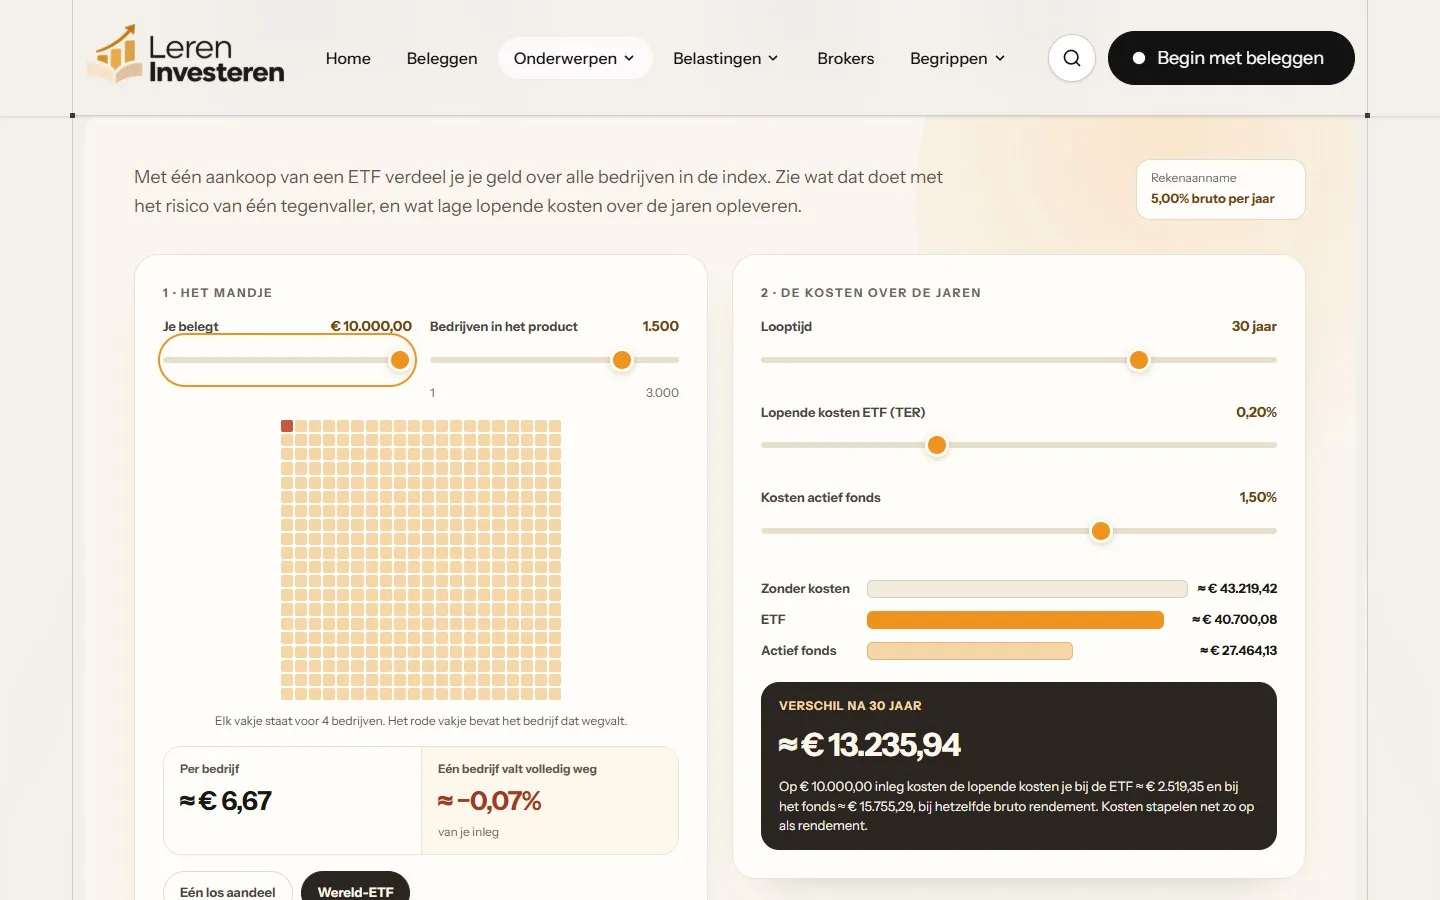
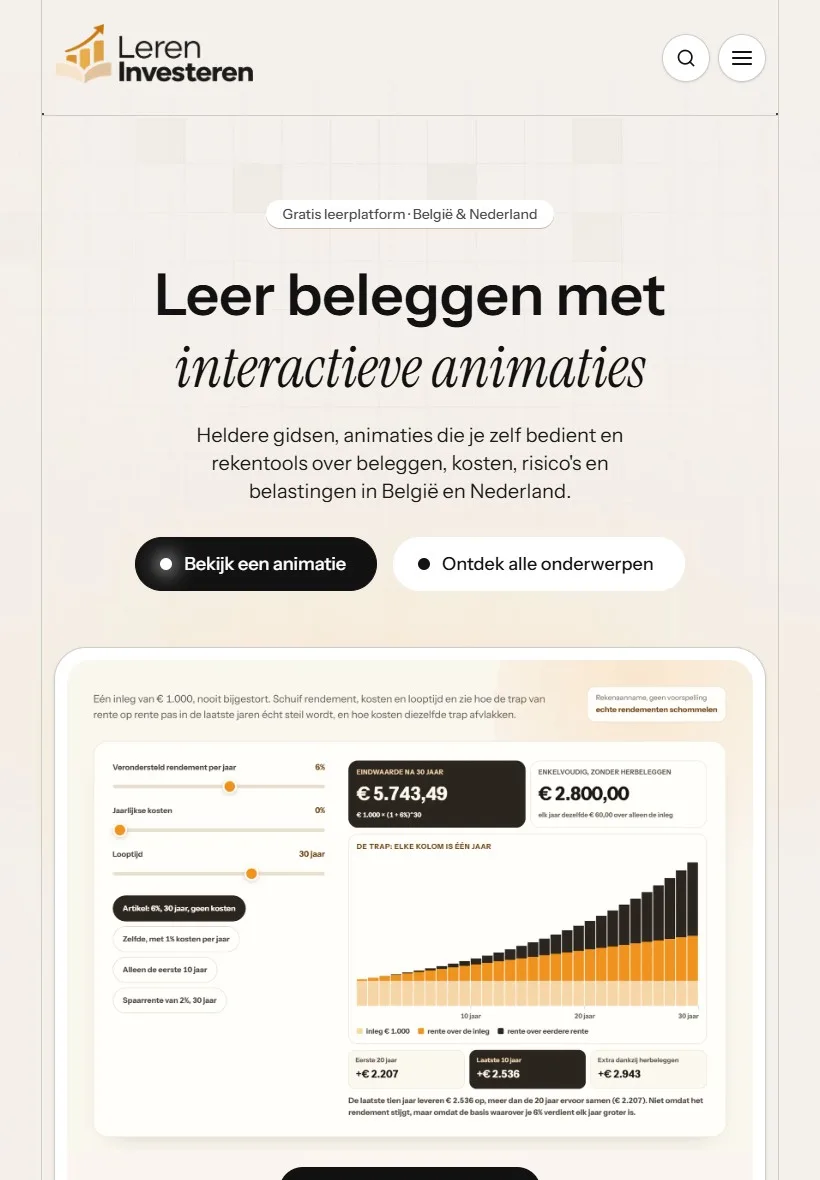
The compound interest guide has three sliders: assumed return, annual costs and time horizon. Increase the return and the final value and the chart change with it. In the EBITDA guide, visitors adjust the operating costs and choose a type of business.
Each animation sits within the guide itself, directly below the title and above the text. The model and the explanation therefore belong together: first see how the mechanism works, then read why.
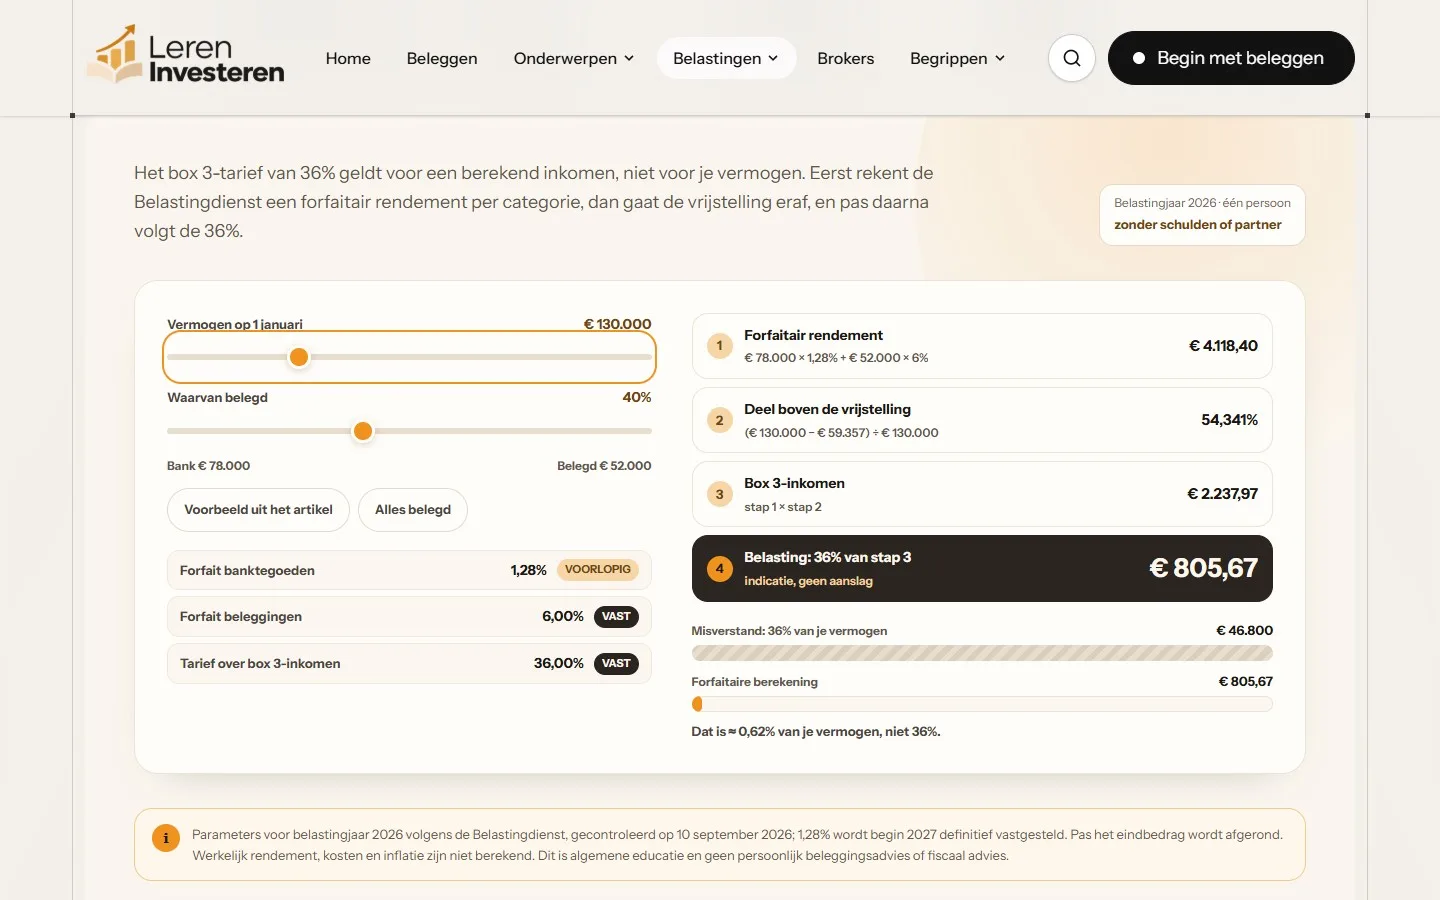
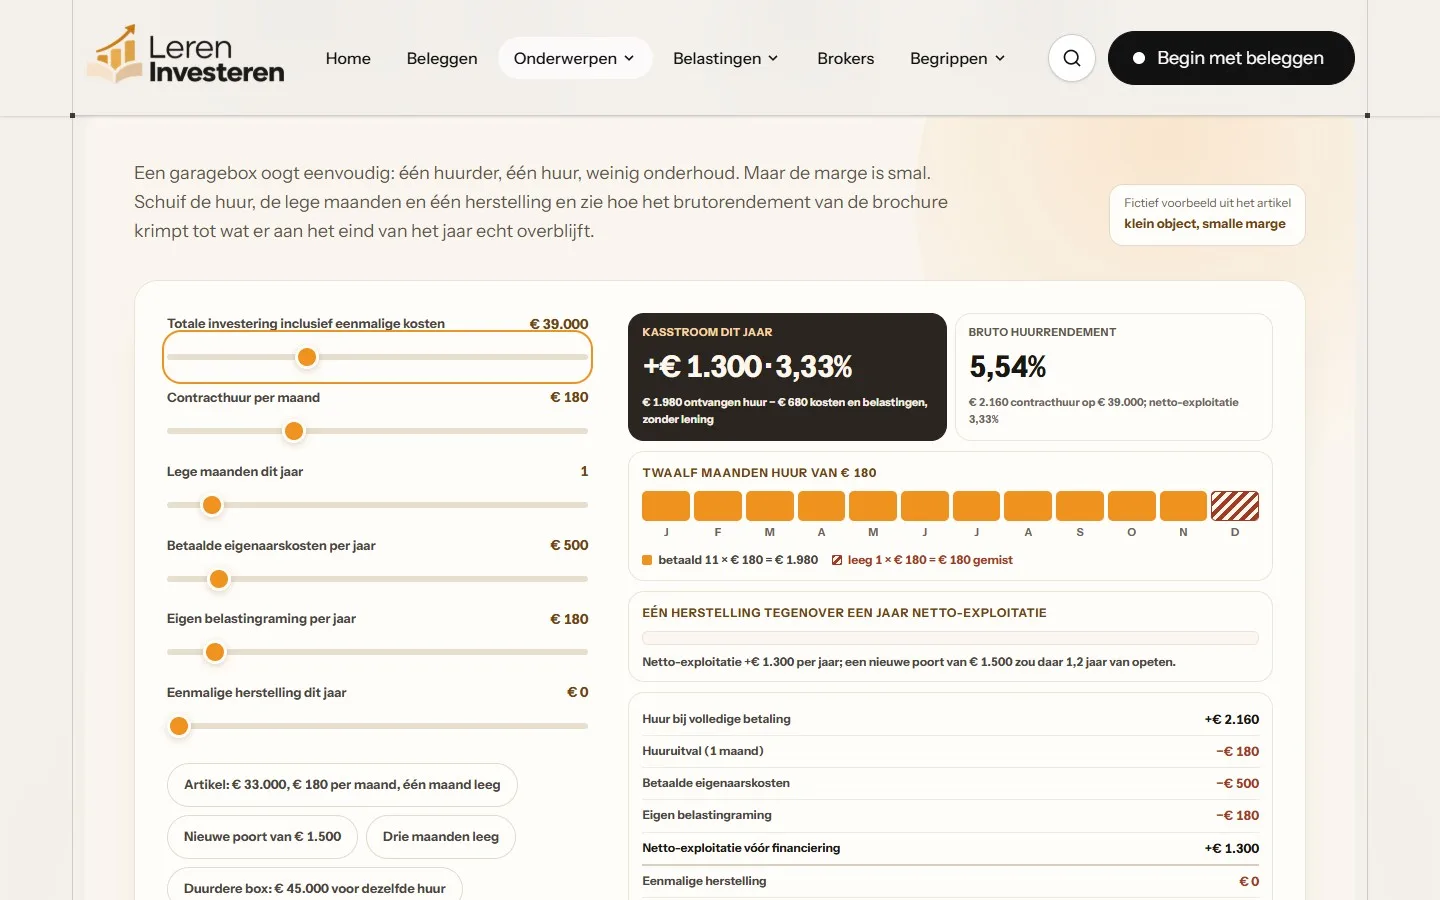
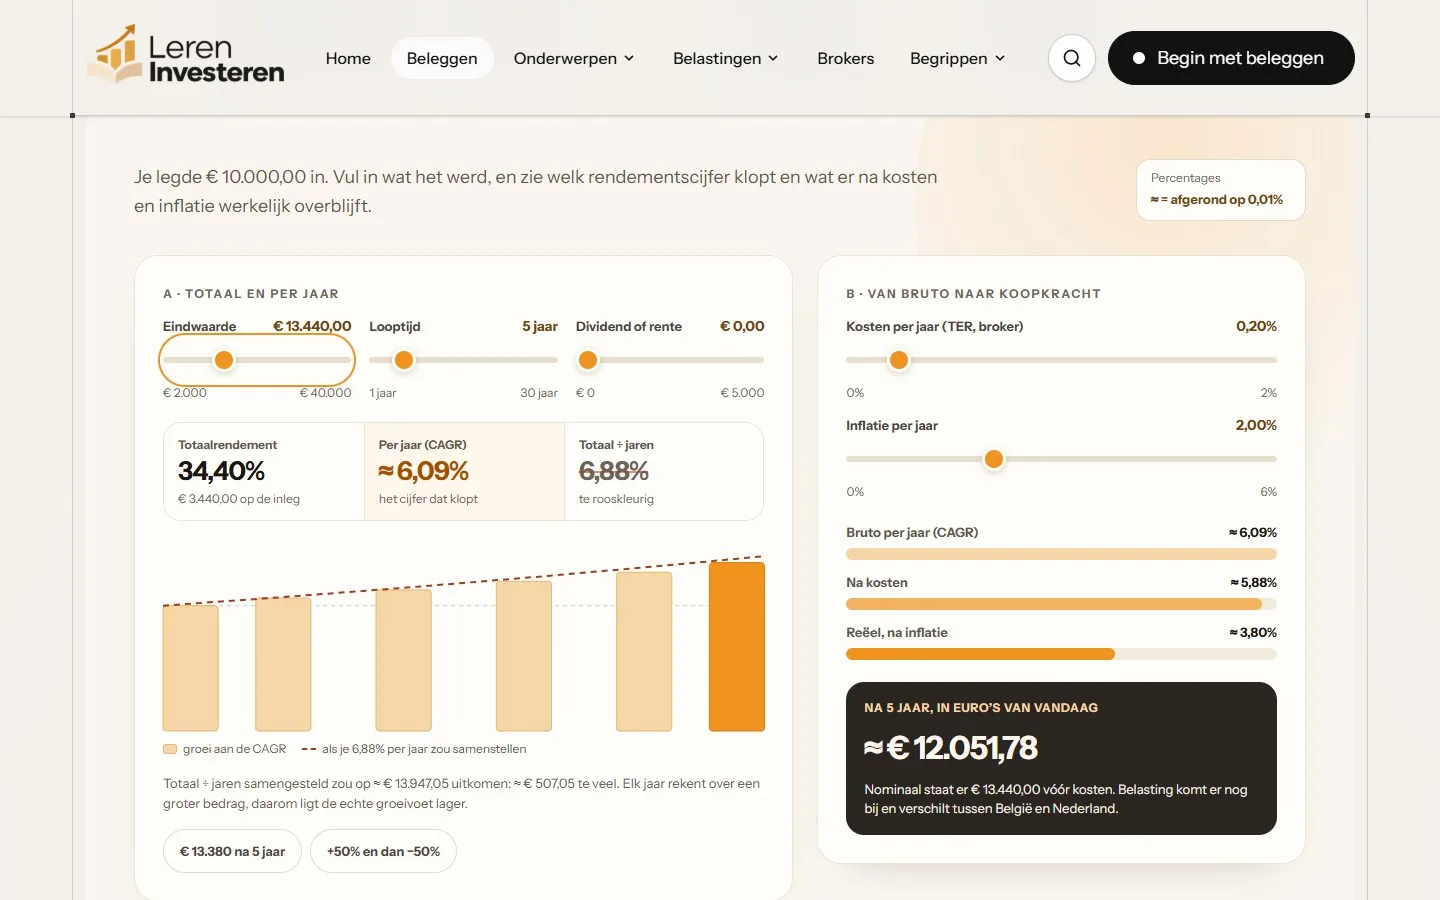
Below are six animations, each shown after a slider has been moved: compound interest, EBITDA, ETFs, the box 3 rate, a garage box as an investment and calculating returns.
From guide to interactive knowledge platform
Leren Investeren is not a blog with standalone articles. The guides form the core, and around them sit the components that turn a guide into a tool.
- Interactive animationsIn the guide, directly below the title.
- CalculatorsNine tools with their own input fields, such as compound interest, rental yield and the Belgian stock exchange tax.
- GlossaryA dedicated page for each term, linked to the glossary.
- Topic pagesAn overview for each topic, with a filter by page type.
- SearchSearches all pages and is accessible from every page.
- Internal linksBreadcrumbs, table of contents, “further reading” and links to terms.
- Investing 31
- Shares 26
- ETFs 27
- Bonds and alternatives 26
- Crypto 28
- Trading 5
- Property 28
- Pensions 29
- Brokers 29
- Glossary 18
- Belgian taxes 26
- Dutch taxes 25
Number of pages per topic, according to the lereninvesteren.eu sitemap on 18 November 2026.
Belgium and the Netherlands: separate where the rules differ
The platform targets two countries with the same language but different rules. Where the rules are the same, there is one guide. Where they differ, each country gets its own page.
Belgium
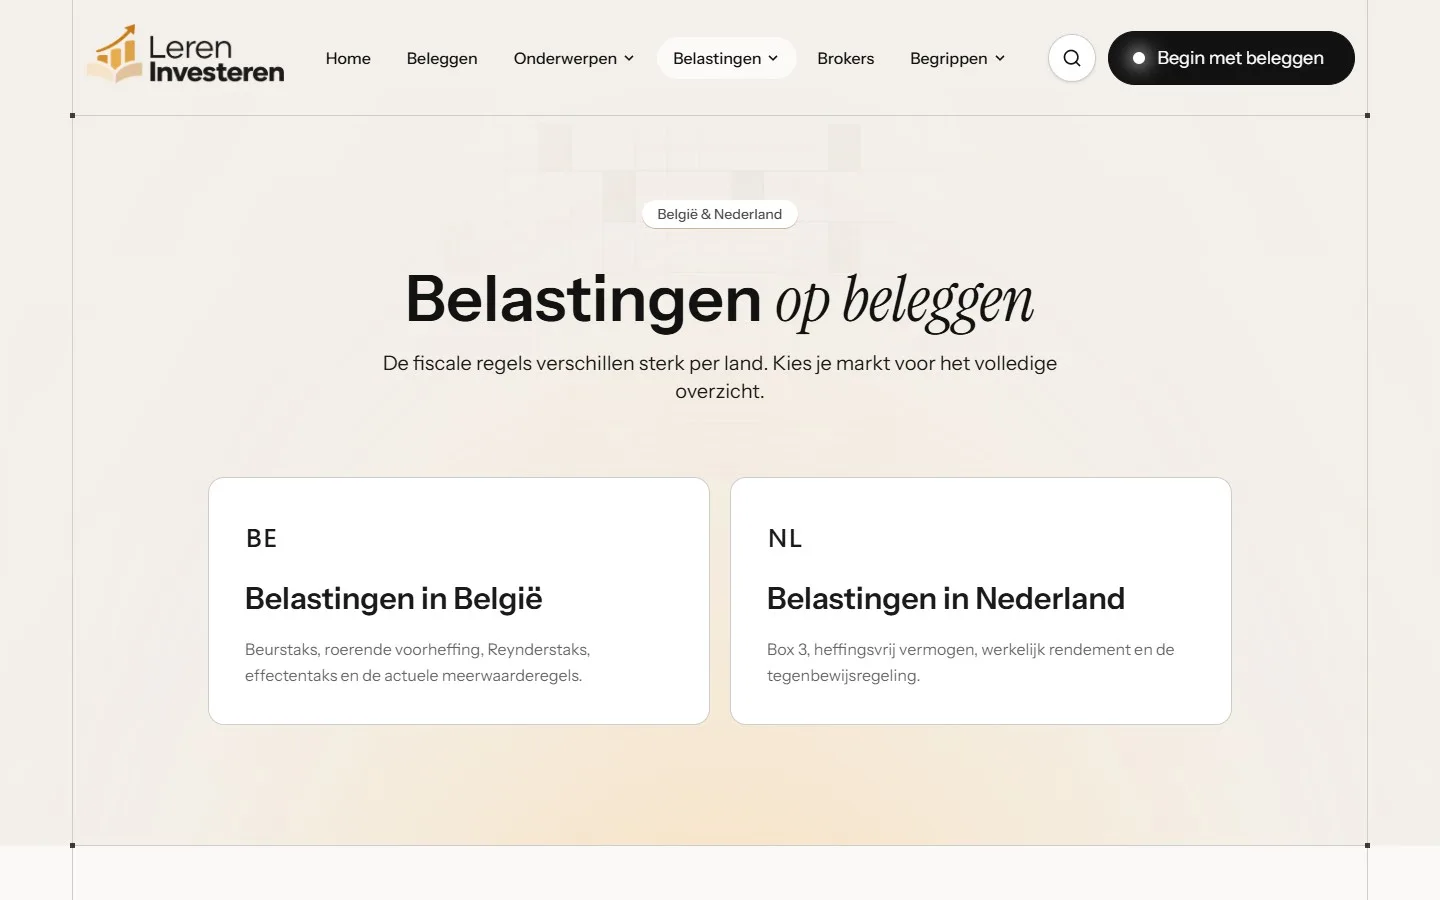
A dedicated tax section
26 pages on taxes in Belgium, including a calculator for the stock exchange tax (TOB).
The Netherlands
A dedicated tax section
25 pages on taxes in the Netherlands, including the box 3 rate and a calculator for wealth tax.
There are also six topics with a Belgian and a Dutch version, such as buying shares and the best broker. A switch on the page takes readers to the version for the other country, and the two versions reference each other in the code as nl-BE and nl-NL.
SEO and GEO: the organic architecture
Discoverability is built into the structure of every page. That applies to search engines and to GEO (Generative Engine Optimization): visibility in AI answers.
- Topic clusterstwelve topics, each with an overview page and guides beneath it
- Clear search intentexplanation, term, comparison, calculator, step-by-step plan, overview and review as separate page types
- Citable answersa definition block, an “in brief” summary and subheadings phrased as questions
- Frequently asked questionson the guides, with matching structured data
- Sourcesa list of sources for each guide, with the date each source was consulted
- Datespublication date and date of last update on every guide
- Internal linksbreadcrumbs, table of contents, “further reading” and links to terms
- Structured dataone coherent graph per page: article, questions, breadcrumb and term
The pages are rendered on the server. The text, the structured data and even the animation controls are already in the HTML that a crawler retrieves. In robots.txt, search engines and AI crawlers are explicitly granted access.
Rankings and traffic figures are not included here. They only belong here with a source and a measurement period.
Trust as part of the design
A platform about money has to be clear about what it is and what it is not. On Leren Investeren, that is built into the structure of the site.
- A disclaimer that states explicitly that nothing on the site constitutes personal investment advice, tax advice or legal advice.
- At the bottom of every page: “Educational information, not personal investment advice.”
- Privacy policy, cookie policy and terms of use as separate pages.
- A page about the editorial team and its working methods.
- Sources below every guide, with the date they were consulted.
- A visible publication date and date of last update.
This lets readers check where a statement comes from and how recent it is. It is no guarantee of better search engine rankings.
This page does not give financial advice either: it describes how the platform is built.
Revenue model and privacy
The platform is funded by advertising through Google AdSense. The site itself states that advertisers have no influence on the content and that there are currently no affiliate links. The architecture can also support affiliate integrations later on.
- Analytics only after the visitor has given consent.
- Advertising cookies are off by default.
- The cookie preference is stored locally in the browser.
- Animations and calculators work without an account.
- According to the privacy policy, whatever visitors enter is calculated in their own browser and not sent anywhere.
This is what the site itself describes; it is not a legal assessment.
Screens
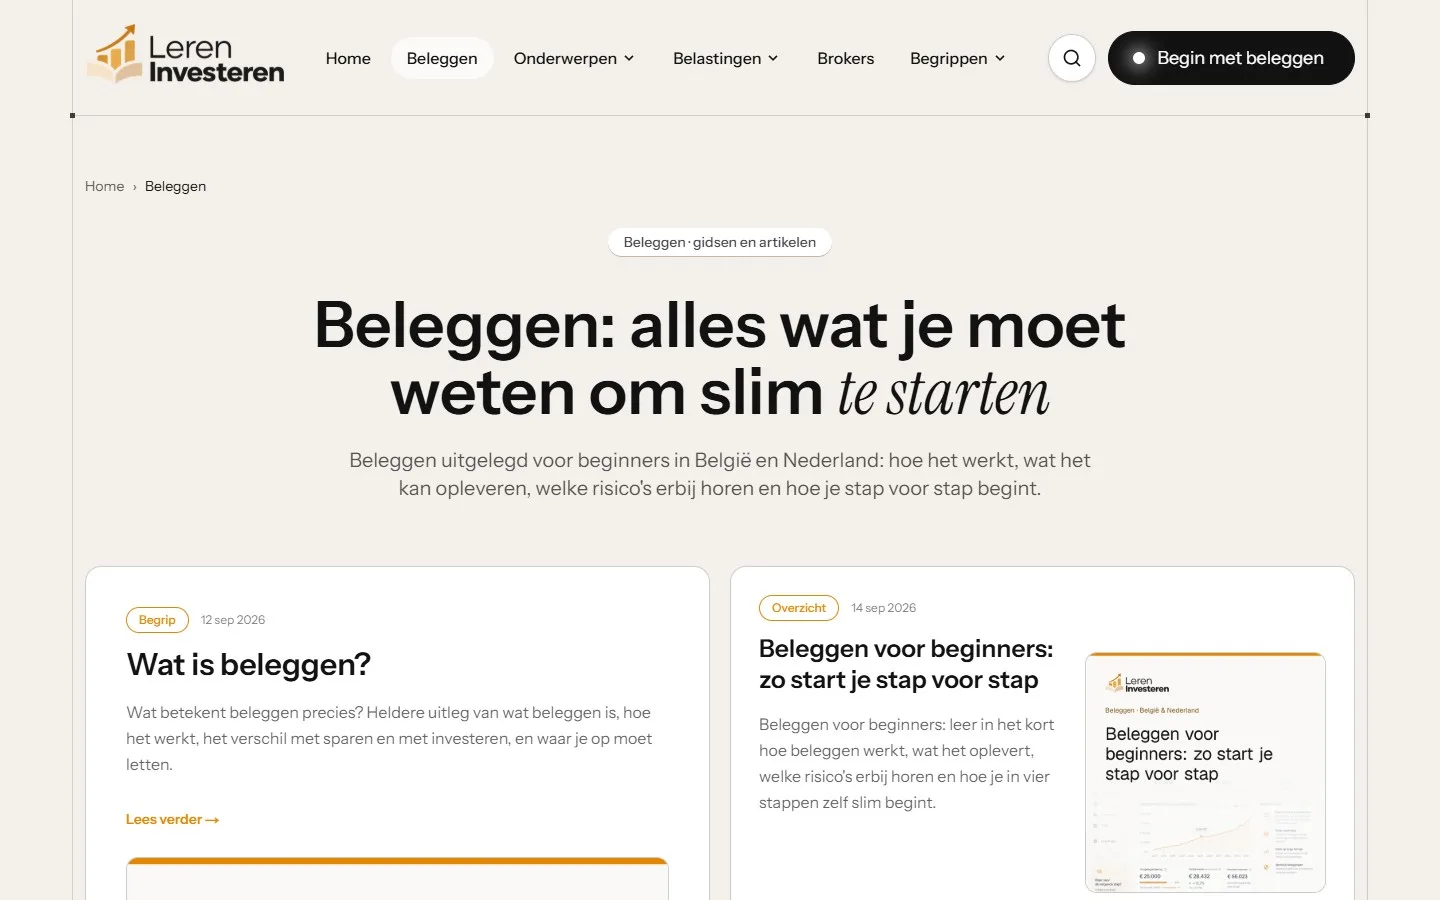
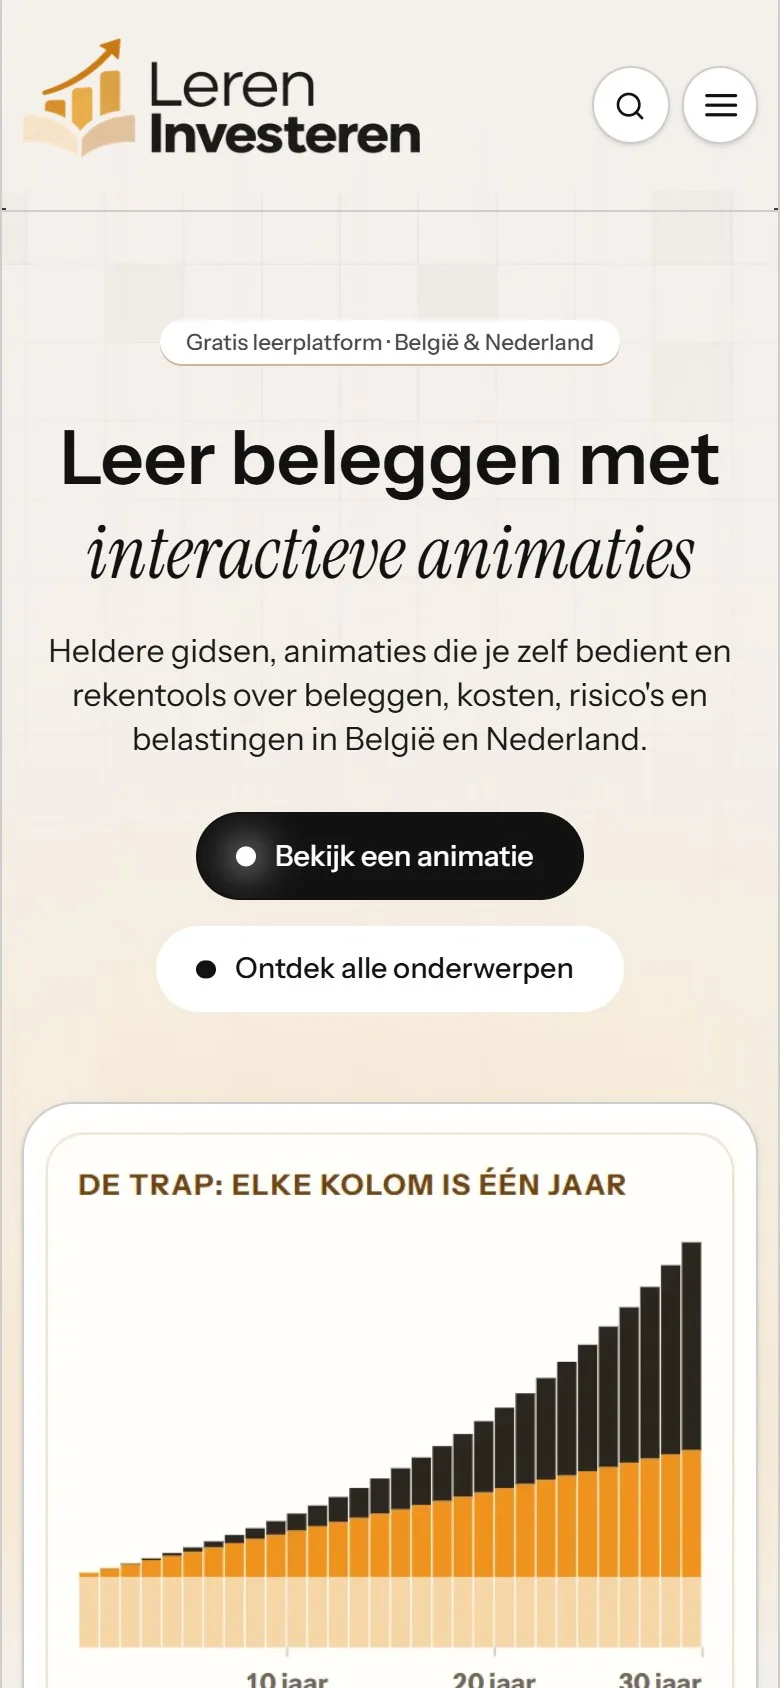
A topic page, the country selection for taxes, the search function and the homepage on tablet and mobile. Screenshots of the live site, taken in November 2026.
Technology
- Pages rendered on the server: the content is in the HTML.
- Animations and calculators that compute in the browser.
- A search function that runs in the browser against its own index of all pages.
- A sitemap for each topic.
Only what is confirmed for this project or publicly verifiable is listed here. Framework and hosting names will follow once confirmed.
More about this way of building
How I approach interactive platforms is described under bespoke web applications. You can read about the organic side of projects like this under SEO consultant and GEO and AI SEO. To discuss a project of your own, get in touch via contact.